W Power 2024

Cell phone data adds new detail to our picture of urban segregation

The movement of millions of phones shows that Americans experience less racial isolation once they get out of their neighborhoods
By Dave Gilson
Published: Aug 18, 2022 10:48:39 AM IST
Updated: Aug 18, 2022 11:04:23 AM IST

Researchers found that most American cities “facilitate diverse interactions.
Image: ShutterstockResearchers found that most American cities “facilitate diverse interactions. Image: Shutterstock

The persistent segregation of American cities is no secret. Even as the U.S. becomes more diverse, many urban neighborhoods remain divided along racial and ethnic lines. The average White resident of a major metropolitan area lives in a neighborhood that’s more than 70 percent White; the average Black, Latino, or Hispanic resident lives in a neighborhood that’s more than two-thirds people of color.

Less obvious, however, is how these divisions translate into daily life, when people leave their homes to work, study, shop, and relax. Census data makes it easy to track residential segregation. But it’s been difficult for researchers to make detailed observations of people’s social interactions as they go about their daily routines, particularly on a large scale.

Or at least it was before everyone started carrying around a portable tracking device.

In one of the first studies of its kind, researchers at Stanford Graduate School of Business and Stanford University used geolocation data from a sample of nearly 18 million cell phones to estimate how much racial separation Americans experience in their everyday lives. Analyzing people’s movements in more than 360 metro areas, they found that most urban and suburban residents are exposed to a more diverse range of people when they leave their neighborhoods, lowering the overall level of segregation they experience.

By measuring people’s “experienced isolation†as they move between more and less integrated spaces, the study adds a new dimension to the picture of America’s racial dynamics. It also finds experienced and residential isolation to be highly correlated: People in cities with more racially mixed neighborhoods are exposed to more members of other races in their daily activities, and vice versa.

Read More

What Do People Do All Day?

The idea for the study originated several years ago, when Susan Athey, a professor of economics at Stanford GSB, got access to a large set of data from a company that aggregates anonymized GPS pings from smartphone apps. “I was trying to think about what kind of important questions could you answer with this extra precision of data,†she recalls. She spoke with Matthew Gentzkow, a Stanford economist, and they decided to focus on segregation.

“There’s a reason to study just residential segregation, but it doesn’t answer every question,†Athey says. “A few people in sociology and other fields had tried to measure where people actually spent time, but those data sets were smaller or pretty skewed in a variety of ways.†The new data, collected during the first four months of 2017, presented an unprecedented chance to study segregation in both space and time.

Athey and Gentzkow teamed up with Tobias Schmidtopen in new window of the Stanford Institute for Economic Policy Research (SIEPR) and Billy Ferguson, a doctoral student in economics at Stanford GSB. Ferguson, who has worked with Athey since he was an undergraduate, was excited about digging into this granular data. “Economists are used to getting vague information about the people in their data set,†he says. He recalls thinking, “This a cool opportunity because now you can actually see where people spend time.â€

The team’s first step was to parse the GPS data to establish which geographical area most likely corresponded to each phone’s home. Those areas were cross-referenced with demographic data to infer whether a particular phone likely belonged to a White person or not. The researchers then mapped where and when the phones spent time — for example, at a restaurant at lunchtime or on public transportation during commute hours.

Source: Athey, Ferguson, Gentzkow, and Schmidt (2021)
“With this richer data,†Athey says, “you can compare what types of activities lead people to mix more or less with other people. It really opens up a different set of questions that are much easier to answer.†Altogether, this multilayered approach captured a detailed image of a city’s patterns of social and economic activity, which was then used to measure people’s proximity to people of other races.

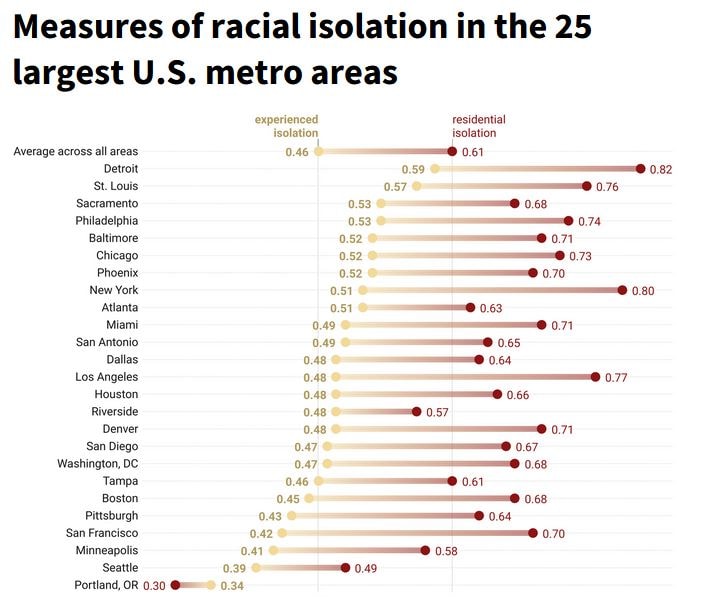
The researchers found that most American cities “facilitate diverse interactions.†Nearly 88 percent of all people followed in the study lived in metro areas where experienced isolation is lower than residential isolation. “We see people are more integrated in a lot of the commercial activity of cities,†Ferguson says.

Also read: Marketing, math and microseconds

In general, places where people shop, eat, enjoy entertainment, or watch sports are among the least segregated spaces. On the other hand, civil, religious, and social institutions such as churches and schools are less integrated. That’s not unexpected, Ferguson says, since religious affiliation often breaks down by race and many schools reflect residential segregation patterns.

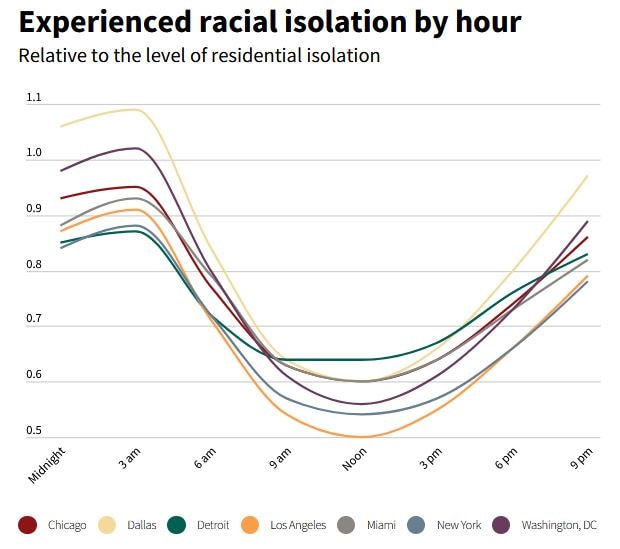
The experience of racial isolation also changes as people move around. Isolation was higher in the mornings and evenings, when Americans are more likely to be at home. “Lunchtime turns out to be a time of day when people mix more,†Athey says. “People are coming in from the suburbs to work, and then everybody’s walking around together, going to lunch together in the middle of the city. That’s a time of day that exposes people to others.â€

Understanding Space and Race

Experienced isolation was lower relative to residential isolation in cities with more population density and public transit use as well as higher levels of education, income, and income mobility. Among the most populous urban areas, Detroit, Philadelphia, and St. Louis had some of the highest measures of residential and experienced isolation; Seattle, Orlando, and Portland, Oregon, had some of the lowest. (Portland, a relatively undiverse city, appears as an outlier on the chart below.)

Source: Athey, Ferguson, Gentzkow, and Schmidt (2021)

While there were significant gaps in the levels of racial division among cities, there was a consistent link between the two main measures of segregation. “There were important differences between residential and experienced segregation, but overall they were more aligned than I would have thought,†Athey says. “If you rank cities based on residential segregation and you rank cities based on experienced segregation, it’s sort of the same ranking,†Ferguson says. “It’s very correlated.â€

That correlation appears to bolster previous research on the broad effects of residential segregation. However, the exact nature of the relationship between residential and experienced isolation is unclear. “We would love to understand a bit more about the causal pathways here,†Ferguson says. “Is where people want to spend time in a city affecting where people live?â€

The research suggests that targeted policies improving access to commercial, leisure, and other public spaces could be important tools for addressing the harmful effects of segregation. As Gentzkow explains in an articleopen in new window by SIEPR, “One thing we can try to do is think about how to change where people live. It takes a long time for that kind of change to happen. This paper points out that people’s actual experiences depend on lots of other things that potentially could change a lot more quickly.â€

The researchers also note that their study is an initial look at a complex topic and has limitations due to its anonymized data and not entirely representative sample. And they acknowledge that while they could measure people’s proximity to each other, they could not confirm actual interactions.

Nonetheless, large-scale geolocation data has already proved to be a powerful research tool, particularly in tracking the spread of COVID-19. Last year, Athey’s GSB colleague Gabriel Weintraub was part of a team that used cell phone data to study the effects of income inequality on public-health restrictions in Chile.

Both Athey and Ferguson are eager to see the approach their team helped pioneer applied to more questions that once would have been untouchable. “I do think it’s going to start growing as a literature, but we’re still a little bit in the early days,†Athey says. “GPS data is this huge resource for economists to study people,†Ferguson says. “Just adding that dimension of movement over time opens up a lot of possibilities.â€

This piece originally appeared in Stanford Business Insights from Stanford Graduate School of Business. To receive business ideas and insights from Stanford GSB click here: (To sign up : https://www.gsb.stanford.edu/insights/about/emails ) ]

X